Signal / Noise Ratio (Sea Level)
- By:
- Edward A. Reid Jr.
- Posted On:
- Apr 7, 2020 at 6:00 AM
- Category
- Climate Change
“Signal-to-noise ratio (abbreviated SNR or S/N) is a measure used in science and engineering that compares the level of a desired signal to the level of background noise.”, everything.explained.today
Another of the primary focuses of climate science is the global sea level and particularly the rate of global sea level increase and any acceleration in that rate of increase. The long historical record of sea level increase has been established using tide gauges along the oceans’ shorelines. More recently, global sea level rise is being measured using satellites in polar orbit which completely scan the oceans every ten days. The tide gauge records indicate a rate of sea level rise of approximately 1.8 mm per year. The satellite records indicate a rate of rise of approximately 3.4 mm per year.
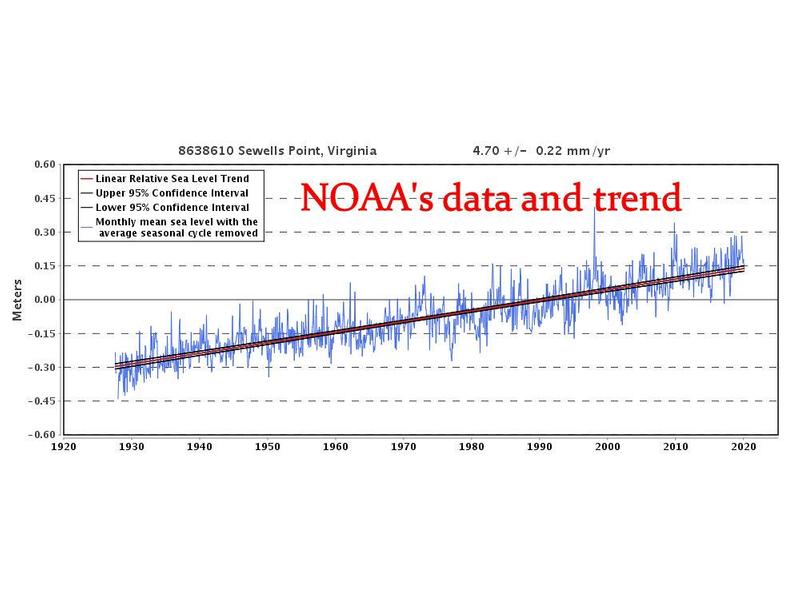
These measured rates are obviously different, but it must be remembered that they are measuring different things and at different frequencies. The measurement of greatest interest is the sea level rise at the shorelines, where the oceans meet populations and their infrastructure. The graph below shows the historic sea level rise at a location in coastal Virginia since 1920, as measured by local tide gauges. The legend on the graph identifies the uncertainty in the measurement of +/- 0.22 mm [per year. However, the uncertainty in the monthly average measurements is +/- 5 mm.
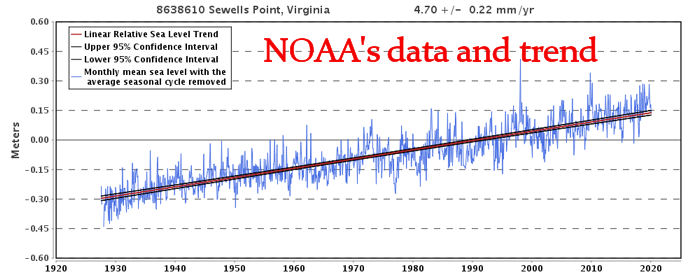
The annual rate of sea level rise at this site is well above the average, but it still is significantly lower than the monthly “noise”, which ranges up to approximately 300 mm. One of the contributors to this above average rate of sea level rise is subsidence of the land along the shoreline as a result of unstable soils and groundwater extraction.
The graph below shows the global sea level rise measured by satellite. Again, note the “noise” in the data relative to the annual change. This noise is largely the result of the continuously changing surface condition of the oceans, which range from ripples to swells to waves of varying heights, depending on wind and storm conditions.
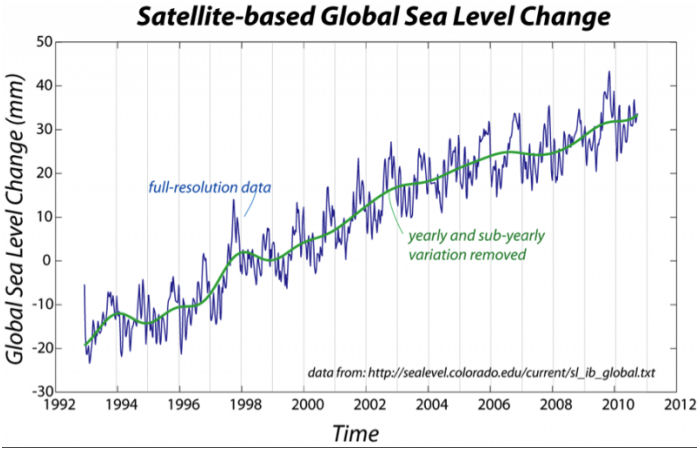
The satellite record currently exceeds 30 years, so that it can be used as a climate reference period. However, it must be noted that the uncertainty of the individual satellite scans of sea level is +/- 4 mm, which is very similar to the uncertainty of the tide gauge records and larger than the annual rate of sea level rise, which is indicative of a very low signal to noise ratio.
There is a high level of interest within the climate science community regarding any potential increase in the historical rate of sea level rise. There is no indication of acceleration in the tide gauge data, though some researchers believe there is such an indication in the satellite data, though the satellite record is quite short. However, the magnitude of the suggested increase in the rate of sea level rise is approximately an order of magnitude less than the annual rate of sea level rise, making it far more difficult to determine against the background “noise”.