Signal / Noise Ratio (Extreme Weather)
- By:
- Edward A. Reid Jr.
- Posted On:
- Apr 21, 2020 at 6:00 AM
- Category
- Climate Change
“Signal-to-noise ratio (abbreviated SNR or S/N) is a measure used in science and engineering that compares the level of a desired signal to the level of background noise.”, everything.explained.today
In the previous commentaries on signal / “noise” ratio regarding temperature and sea level we discussed ongoing phenomena monitored by frequent measurements which displayed large measurement to measurement “noise” relative to the magnitude of the ongoing phenomena.
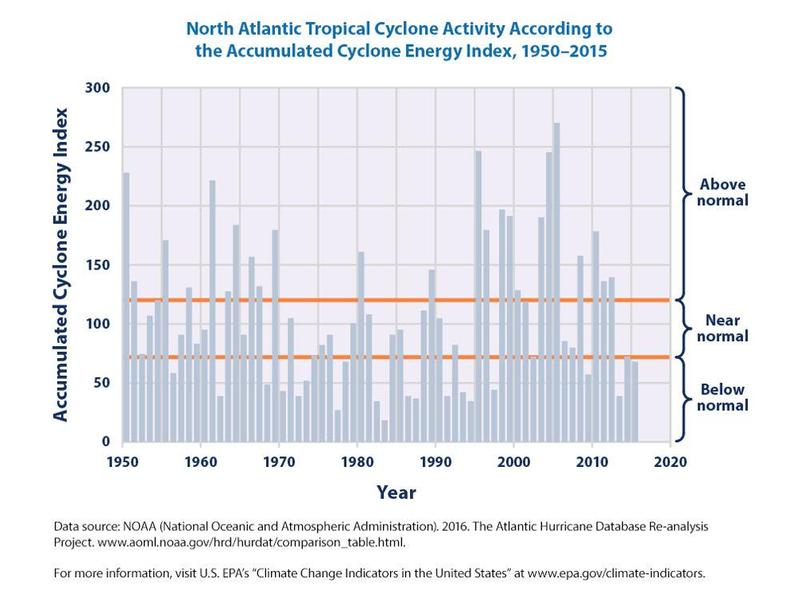
In the case of extreme weather, we are dealing with episodic events such as tropical cyclones, tornadoes, floods and droughts. These events are counted and/or measured on a seasonal, annual or multi-year basis, since they occur relatively infrequently. The frequency of occurrence of these phenomena and their intensity or duration varies widely from year to year, as shown in the bar chart below for tropical cyclones.
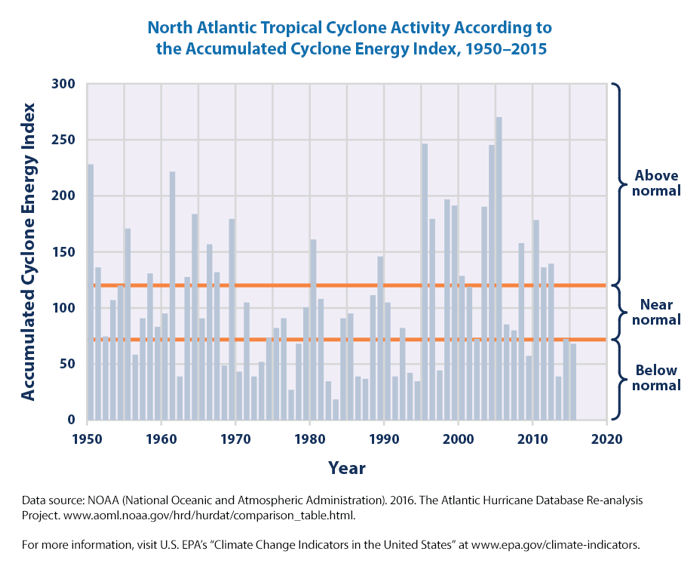
There is no clear trend in the data and there are order of magnitude year to year variations.
Tornadoes do not demonstrate the magnitude of year to year variation exhibited by hurricanes. However, they do present an interesting anomaly. Annual tornado reports show a positive trend, in part because of improved reporting of less intense tornadoes. However, the frequency of intense (F3-F5) tornadoes shows a declining trend.
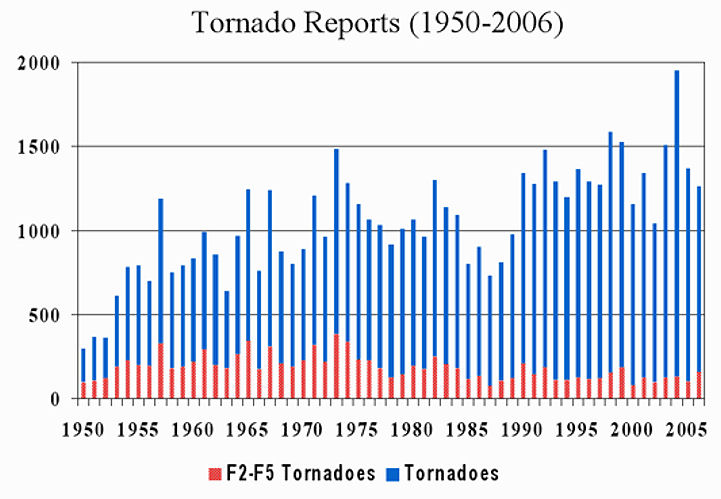
The “noise” in the total tornadoes data is significantly greater than in the severe (F2-F5) tornadoes data.
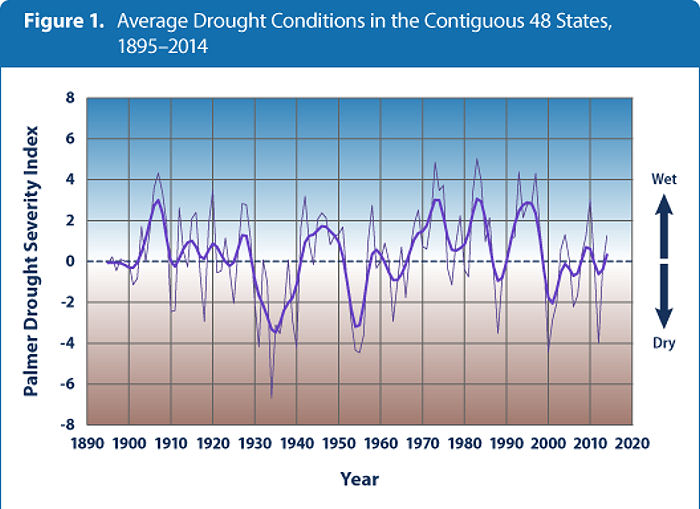
Drought data displays very large variations in drought conditions, but with no trend toward increasing drought frequency, duration or severity.
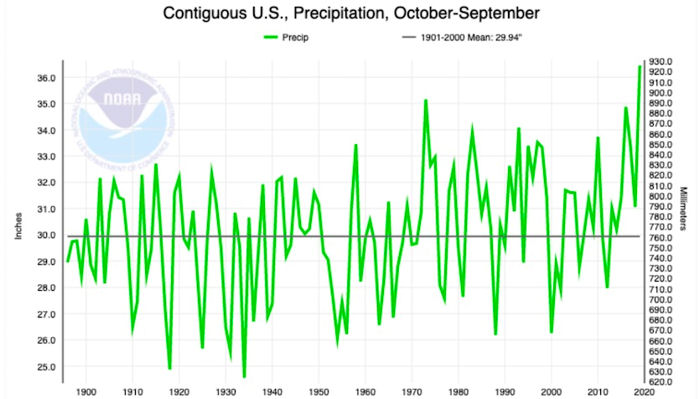
Precipitation data displays characteristics similar to the drought data, as expected, though with a slightly increasing trend.
The data for these episodic events, like the data for the near-surface temperature and sea level rise, provide no support for the existence of a crisis or emergency, particularly one caused by anthropogenic climate change.
The magnitude and apparent randomness of the year-to-year variations in these episodic events show no correlation with increasing atmospheric CO2 concentrations, or with the near-surface temperature and sea level rise data, no less any indication of potential causation. The tropical cyclone, drought and precipitation hint at long term cyclical variations, but the length of the data records are short relative to the periods of the major ocean oscillations, for example.
All of this indicates that there is much we do not currently understand about global or regional climate and the natural cycles which influence the climate, clearly indicating that the science is hardly “settled”. However, it does suggest high priority areas for future climate research, including study of the cyclical ocean phenomena such as the Pacific Decadal Oscillation and the Atlantic Multi-decadal Oscillation, both of which are long period phenomena which have not been thoroughly documented over multiple cycles.