Near-Surface Temperature
- By:
- Edward A. Reid Jr.
- Posted On:
- Apr 16, 2019 at 6:00 AM
- Category
- Climate Change
Much has been written about the physical shortcomings of the near-surface temperature record, which include:
- inadequate spatial coverage;
- urban heat island effects;
- sensor degradation;
- enclosure degradation;
- wind and solar dependent biases;
- inconsistent time of observation;
- missing data; and,
- numerous lesser issues.
These issues have been compounded by sensor and enclosure changes over time and measuring station relocation. These factors have led to “adjustment” of the measured temperature data intended to account for these issues.
Far less attention has been paid to the statistical shortcomings of the near-surface temperature record. Two of the most important statistical shortcomings are improper treatment of measurement noise and inadequate frequency of measurement.
Dr. Patrick Frank has calculated the lower limit of instrument noise in the global temperature record for well sited and maintained installations as +/-0.46°C. He has further estimated that the lower limit of the instrument noise for the global near-surface temperature installations is likely twice the lower limit of +/-0.46°C for well sited and maintained sites. These values far exceed the confidence limits (+/-0.10°C) typically reported by the producers of the global temperature anomaly products. If Dr. Frank’s estimate of the instrument noise in the global records is correct, the instrument noise is greater than the reported global temperature anomaly over the entire period of the global instrument temperature record, rendering the reported anomalies insignificant, as discussed in more detail here.
William Ward asserts that “air temperature is a signal and measurement of signals must comply with the mathematical laws of signal processing. The Nyquist-Shannon Sampling Theorem tells us that we must sample a signal at a rate that is at least 2x the highest frequency component of the signal. This is called the Nyquist Rate. Sampling at a rate less than this introduces aliasing error into our measurement.” Ward demonstrates that the aliasing error resulting from recording only daily maximum and minimum temperatures and calculating the mean of those two temperature readings results in a mean aliasing error of 1.4°C, approximately 50% greater than the reported global temperature anomaly over the period of the global instrumental temperature record. Ward also demonstrates that daily errors range up to +/-4°C.
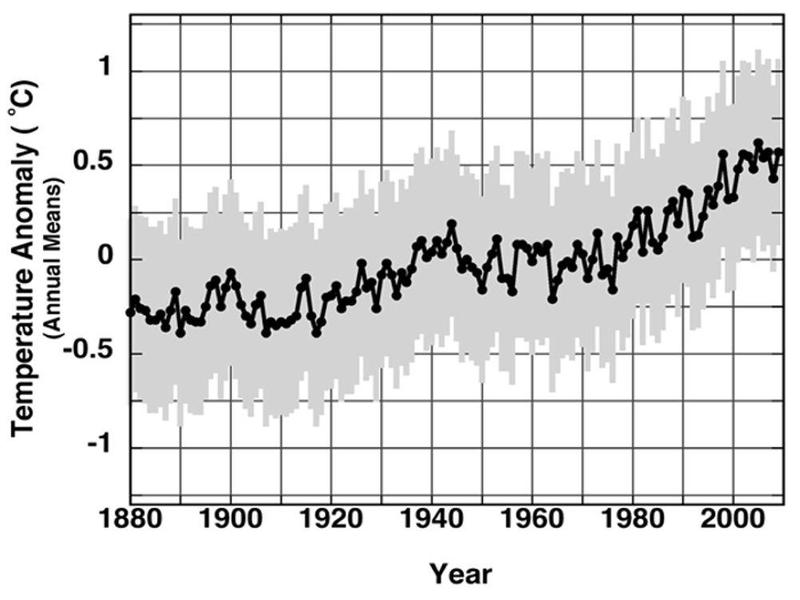
Ward also demonstrates that temperature sampling at rates less than the Nyquist Rate can induce errors in the calculated temperature trends. Trend errors calculated for 26 selected sites range from +0.24°C to -0.17°C per decade, with an average of 0.06°C per decade. This compares with a reported warming trend over the period 1880-2012 of 0.064 +/- 0.015°C (Wikipedia) and a reported warming trend of 0.13°C per decade over the period of the satellite temperature record. Essentially, the reported warming trend shown above is actually (0.064 +/- 0.015°C) +0.24°C / -0.17°C; that is, it is essentially meaningless.
The USCRN is currently considered to be the “gold standard” for near-surface temperature measurement because its sites are CRN-1 sites, located remotely from existing development, use three separate precision temperature sensors and are sampled at the practical Nyquist Rate of 4,320 samples per day, or one sample every 20 seconds. The CRN is the reference for both the Frank and Ward studies. Unfortunately, the CRN is not a global system and it lacks a 30 year historical climate reference period.