Memo to President Trump
- By:
- Edward A. Reid Jr.
- Posted On:
- Nov 13, 2018 at 5:39 AM
- Category
- Climate Change

Mr. President
Many share your reasonable and clearly articulated skepticism of the climate change “consensus” and the consensed climate change community, including many active climate scientists. Regrettably, among the reasons for this skepticism are the actions of three organizations within the Executive Branch of the U.S. federal government: the National Aeronautics and Space Administration’s Goddard Institute of Space Studies (NASA GISS); the National Oceanic and Atmospheric Administration (NOAA); and, the National Centers for Environmental Information (NCEI).
These organizations are involved in the collection and analysis of near-surface land temperature data and ocean surface temperature data. Each of these organizations selects from among the data collected globally, “adjusts” the chosen data, analyzes the “adjusted” data and produces reports detailing the temperature anomalies the “adjusted” data portray from a selected reference period. Clearly, the data are not “adjusted” because they are highly accurate, but rather because they are known / believed to be inaccurate for a variety of reasons.
The National Association of Scholars recently published a study regarding the irreproducibility of scientific results. The focus of the study was on the inability of scientists to reproduce the results of studies conducted by other scientists, using the same data and methods or similar samples and methods. Einstein is reputed to have defined insanity as: “continuing to do the same things and expecting different results”. He might well have defined irreproducibility as continuing to do the same things and achieving different results.
Recent analyses suggest that NASA GISS, NOAA and NCEI have an internal irreproducibility problem – they appear to be unable or unwilling to reproduce their own results.
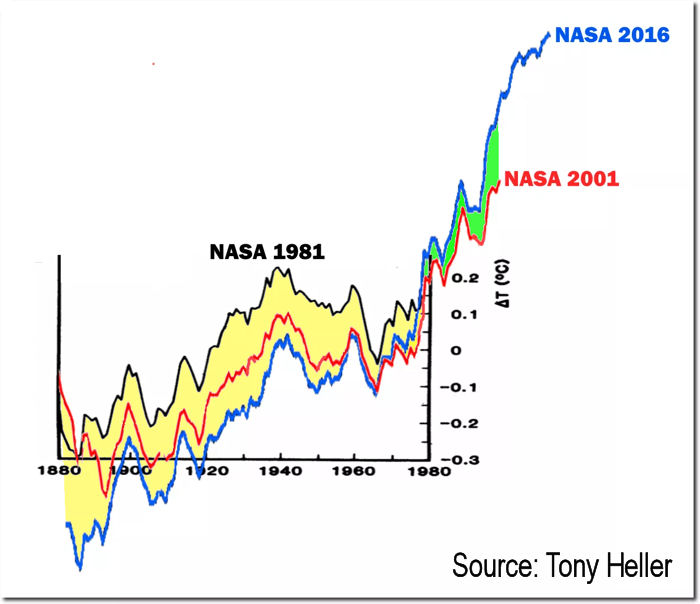
Unfortunately, there is a history of multiple adjustments to the temperature anomalies over time. The graph below displays two instances of “adjustments” to, or “re-analysis” of, the global temperature anomaly record made by NASA GISS. The climate over the period from 1880 to 1980 and its actual anomaly from the reference period did not change. However, the reported anomaly over the period did change. The anomaly was reduced by as much as ~0.2°C early in the period, thus increasing the apparent rate of increase of the anomaly over the period, as shown in the area highlighted in yellow in the graph. The climate over the period from 1980 to 2001 and its actual anomaly from the reference period also did not change. However, the reported anomaly over the period did change. The anomaly was increased by as much as 0.2°C late in the period, as shown in the area highlighted in green in the graph, again increasing the apparent rate of increase of the anomaly over the period. We cannot determine from the information in the graph the number of times the anomalies were “adjusted” or “re-analyzed”. We can only determine the cumulative effects of the “adjustments” or “re-analyses”, which appear to total ~0.4°C, or approximately 1/3 of the reported anomaly change over the entire 136-year period. We do not know which, if any, of the anomaly plots contained in this graph is accurate. We do know, however, that they cannot all be accurate.
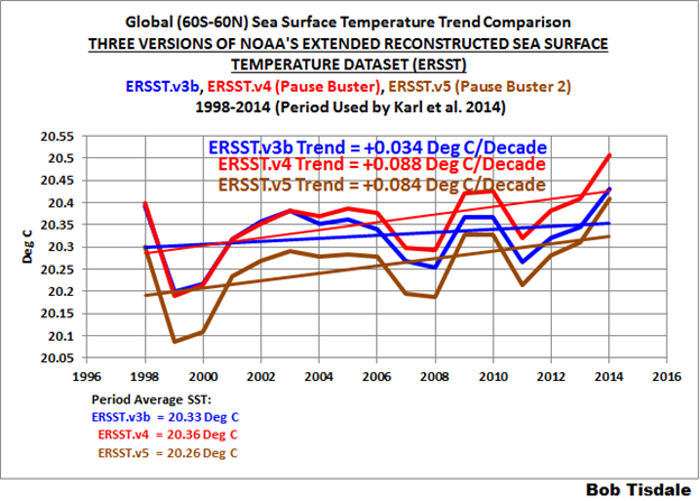
NOAA has a similar issue with the sea surface temperature analyses. The graph below shows three versions of the NOAA Extended Reconstructed Sea Surface Temperature “Dataset” developed by NCEI. (The term “dataset” is shown in quotes because once data are “adjusted” they cease to be data and become merely estimates of what the data might have been had they been collected timely from properly selected, calibrated, sited, installed and maintained sensors.) The differences between the graphs are approximately 0.1°C at the end points, but the changes in the more recent ERSST.v4 and ERSST.v5 graphs more than double the reported rate of change of sea surface temperature. Again, we do not know which of the graphs is accurate, but we know that they cannot all be accurate. While the reported temperature anomalies are small, the specific heat of water is approximately 4 times the specific heat of air and the oceans represent approximately 70% of the surface of the earth. Therefore, the difference in the amount of energy represented by the temperature anomaly change is dramatically larger than the difference represented by the near-surface temperature anomalies.
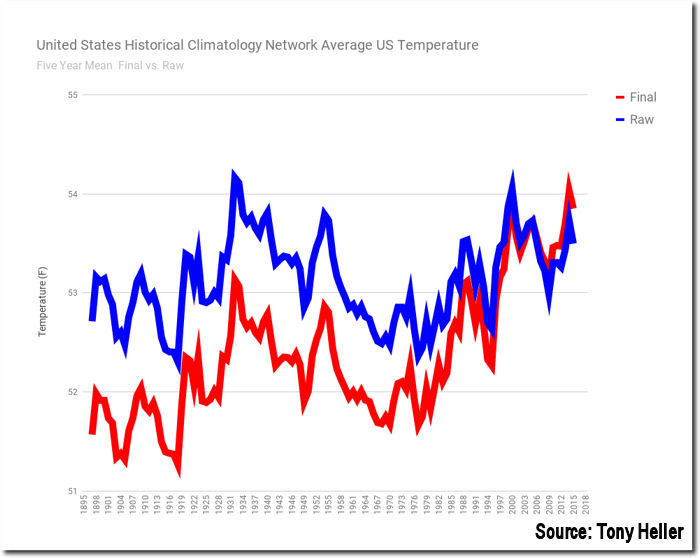
The magnitude of the “adjustments” made to the U.S. near-surface temperature anomaly data by NOAA has varied significantly with time, as shown in the graph below. The earlier “adjustments” represent a reduction from the measured data to the reported estimates of approximately 1°C, or approximately the same magnitude as the reported global temperature anomaly change over the entire period of the global instrumental temperature record. These “adjustments” make the U. S. temperature anomaly appear larger and dramatically increase the reported rate of change of the temperature anomaly.
It is long past time for the U.S. federal government to form a Tiger Team of skeptical climate scientists and statisticians to critically evaluate the entire process of temperature data acquisition, data “adjustment”, data analysis and reporting of results at NASA GISS and NOAA NCEI.
The consensed climate science community has recently called for the construction of a global near-surface temperature measurement network similar to the US Climate Reference Network. The key feature of the US CRN is that the data do not need to be “adjusted”. The consensed climate science community has also recently acknowledged that the current ensemble of climate models is “running hot”, producing potential future scenarios with temperature anomalies two to three times the anomalies present in the “adjusted” near-surface observations. Both events represent potential positive signs that the consensed climate science community might be getting serious about collecting accurate data and producing plausible projections of potential future climate conditions.
The potential costs in capital and human deprivation represented by the approaches to CO2 emissions reductions proposed by the UNFCCC and the IPCC demand that the climate be measured and understood far better than is the case today before these approaches are aggressively pursued. You have understood and responded to these issues by withdrawing the U.S. from the Paris Accords. You now have the opportunity to take the lead in advancing the science of climate change.