Key Climate Graphs
- By:
- Edward A. Reid Jr.
- Posted On:
- Mar 16, 2021 at 3:00 AM
- Category
- Climate Change
Graphs are a powerful tool for illustrating, explaining and summarizing technical information. They are frequently used in climate science to provide historical information and perspective on various aspects of weather, climate and climate change. They are also used to illustrate potential future changes in aspects of climate based on climate models.
The most important aspects of weather in the context of climate and climate change are related to recurring events such as El Nino and La Nina (ENSO), tropical cyclones, floods, droughts, heat and cold waves, tornadoes and wildfires. The extent of the historical records of these various weather events varies. The records are also affected in recent years by the availability of satellites which can detect smaller tornadoes and tropical cyclones which would have been more difficult to detect previously.
The most important aspects of climate and climate change are related to longer term changes (30+ years), including atmospheric CO2 emissions rates and cumulative concentrations, global temperatures and temperature anomalies, global sea level and rate of sea level rise, and model projections of future changes in these climate measures.
One of the primary requirements of good scientific graphical presentations is that the graph cover the entire period for which data is available so that the historical context is available to the users. It is also important that any changes in the sources or methods of collection of the data be explicitly noted. The most significant of these sources and methods issues are the change from proxies to instrumental data and changes in the instruments used to collect the instrumental data.
The following series of commentaries will present several of the most important graphs illustrating each of these climate and weather issues.
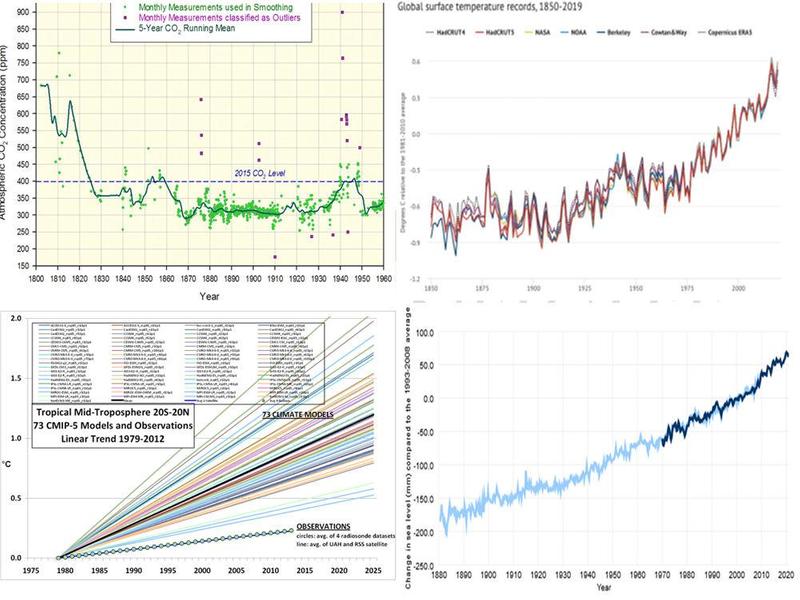
Carbon Dioxide Emissions and Atmospheric Concentration
Global Temperature
Sea Level and Sea Level Rise
Climate Models
Weather Events
The graphs have been selected to provide perspective on the climate changes and weather events occurring currently. Each graph will be accompanied by observations on its significance and comments on its important characteristics. Note that none of the various line graphs display uncertainty bands, though there is significant uncertainty regarding the graphed values, especially where the graphs include proxy information. The information presented in the bar graphs is typically based on counted observations and thus less subject to uncertainty, though not completely immune from it.