Hansen Revisited – Were the Climate Models Right?
- By:
- Edward A. Reid Jr.
- Posted On:
- Sep 19, 2017 at 7:33 AM
- Category
- Climate Change
The World Meteorological Organization typically defines climate as average weather over a period of 30 years. In climate science, then, it is useful to compare observed weather over a 30 year period with the scenarios of future climate produced by climate models, to assess the accuracy and predictive skills of the models.
Perhaps the most widely recognized climate model scenarios covering the period of 30 years ago until the present are the model scenarios produced by Dr. James E. Hansen of NASA GISS in the mid-1980s. These model scenarios were the subject of the now infamous Wirth / Hansen “warm hearing room” presentation to the US Congress in 1988. The graph presented by Dr. Hansen at this hearing is reproduced below.
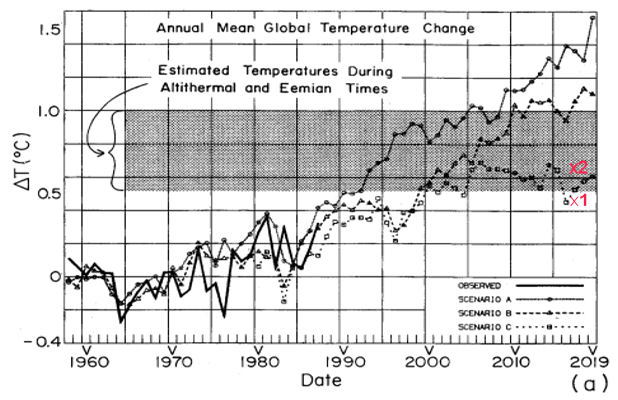
Scenario A: Continued annual emissions growth of ~1.5% per year
Scenario B: Continued emissions at current (mid-1980s) rates
Scenario C: Drastically reduced emissions rates from 1990 – 2000
The ‘x’ labeled ‘1’ located at approximately June 2017 at 0.46oC is the current 0.21oC satellite global tropospheric temperature anomaly produced by UAH added to the anomaly of approximately 0.25oC shown in the graph above for 1980.
The ‘x’ labeled ‘2’ located at approximately June 2017 at 0.65oC is the current HadCRUT4 near-surface temperature anomaly.
Global annual CO2 emissions have continued to increase at approximately the 1.5% per year rate assumed by Dr. Hansen for his Scenario A, rather than leveling off at 1980 rates, as assumed for Scenario B, or declining drastically, as assumed for Scenario C. Global annual temperature anomalies, however, continue to be below the continued 1980s emissions level Scenario B (HadCRUT) or below the drastic reduction Scenario C (UAH).
The HadCRUT anomaly is currently approximately 0.40oC below the Scenario B level and approximately 0.6oC below the Scenario A level. The UAH anomaly is approximately 0.05oC below the Scenario C level, 0.6oC below the Scenario B level and 0.9oC below the Scenario A level. Clearly, the models and model inputs used by Dr. Hansen produced future climate scenarios significantly warmer than the actual climate for the period 1987 – 2017. However, we only have the luxury of that knowledge 30 years (one climate period) after the scenarios were produced.
It is likely that climate models have improved since the models used by Dr. Hansen in the mid-1980s. However, we will not be able to verify any improvement until scenarios produced by those models reach 30 years of age and can be compared against that same 30 years of observations. The model mean of the CMIP5 ensemble is still substantially warmer than any of the near-surface or satellite temperature anomaly products.
There is still no verified climate model; and, there is no climate model which has demonstrated predictive skill. Therefore, there is still no climate model which forms a reliable basis for major global or national climate change or economic policy. Clearly, that has not prevented, or even discouraged, the UN and most of its members from pursuing a modestly aggressive CO2 emissions reduction effort, with the goal of achieving zero net global annual CO2 emissions, if not by 2050, then certainly by the end of the century.