Graphical Misinformation - ORIGINAL CONTENT
- By:
- Edward A. Reid Jr.
- Posted On:
- Aug 15, 2023 at 7:00 AM
- Category
- Climate Change
The UN recently reported that “extreme weather caused two million deaths, cost $4 trillion over the last 50 years”.
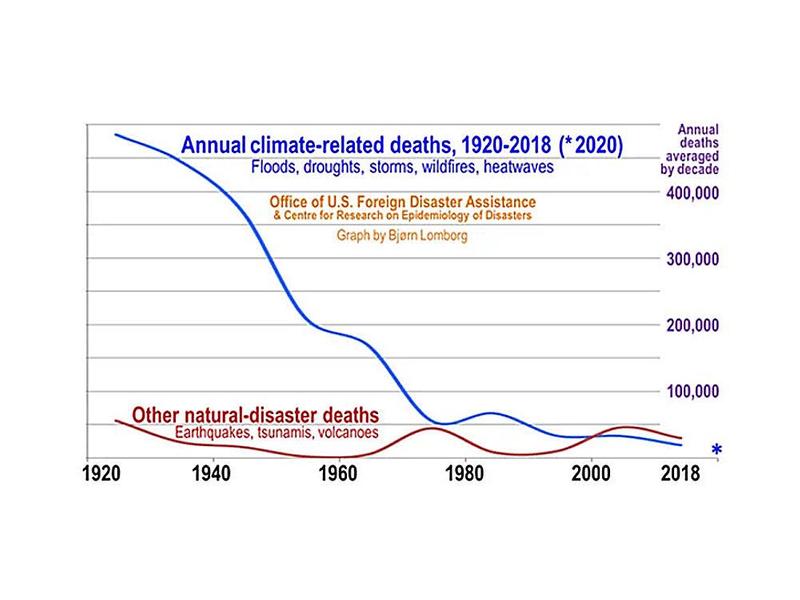
The graph below, prepared by Bjorn Lomborg, plots annual deaths, averaged by decade, from extreme weather and other non-weather events.
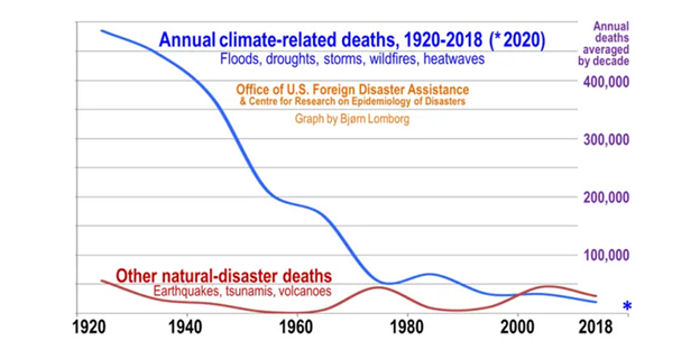
The graph provides both accurate information and misinformation in several ways. The graph accurately plots all the available data, showing the decrease in deaths from extreme weather over the period for which accurate data are available. The decrease is most dramatic prior to 1970, though the decrease continues through the following 50-year period, which is the focus of the UN report.
The graph is labeled “Annual climate-related deaths” and identifies “floods, droughts, storms, wildfires and heatwaves” as the “climate-related” events of interest. However, the UN accurately describes extreme weather events as the cause of the deaths, not climate.
The deaths of interest are “climate-related” to the extent that climate is the sum of weather over a period of 30 years, as specified by the World Meteorological Organization (WMO). The choice of “climate-related” would appear to suggest some contribution of climate change to the ongoing deaths. However, the continuing decline of extreme weather deaths is inconsistent with the suggestion that climate change is making extreme weather events more extreme or more frequent.
The subheading of the graph includes heatwaves, but does not include cold waves, although studies reported by The Lancet suggest that deaths from cold are approximately 10 times greater than deaths from heat, even in areas with warm climates.
The subheading also includes wildfires, which are not actually extreme weather events, though lightning strikes are one identified cause of fires which might develop into wildfires under certain conditions. However, there are numerous other causes of wildfires which are not weather-related or climate-related, including electric transmission and distribution faults, improperly controlled cooking and campfires and arson. There are also factors which can cause fires to become wildfires, including poor forest management practices.
The UN report includes the following explanation: “Over two million deaths and $4.3 trillion in economic losses; that’s the impact of a half-century of extreme weather events turbo-charged by man-made global warming, the World Meteorological Organization (WMO) said on Monday.” However, the data over the past half-century shows little evidence of the “turbo-charging” by “man-made global warming” asserted by the WMO. In fact, this assertion, while consistent with the political IPCC Summary for Policymakers and Synthesis Report, is inconsistent with the data as analyzed in the IPCC Assessment Reports.
The UN report also gives no recognition to the results of normalization studies which demonstrate that the principal causes of the increase in economic losses are increasing GDP and increasing construction of infrastructure in areas subject to extreme weather events. The continuing decline in deaths from extreme weather events is moderated somewhat by increasing population in areas subject to extreme weather events.
It appears essential that events resulting in large numbers of deaths and massive economic losses be analyzed and reported clearly and carefully. In this case, the UN has failed to do so.