CO2 Graphs
- By:
- Edward A. Reid Jr.
- Posted On:
- Mar 23, 2021 at 3:00 AM
- Category
- Climate Change
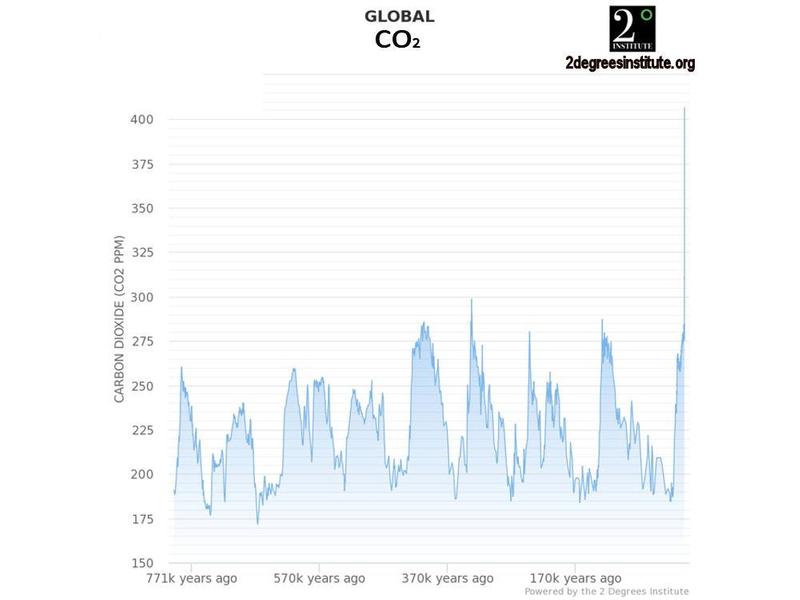
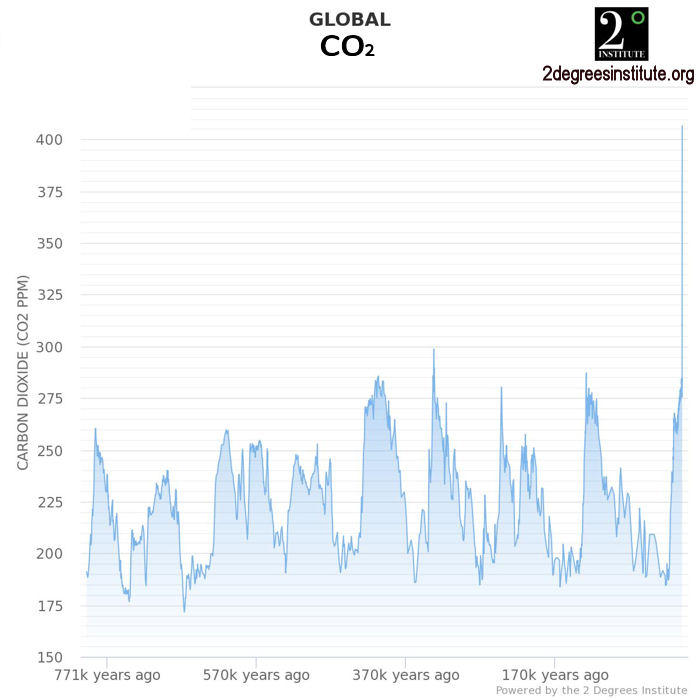
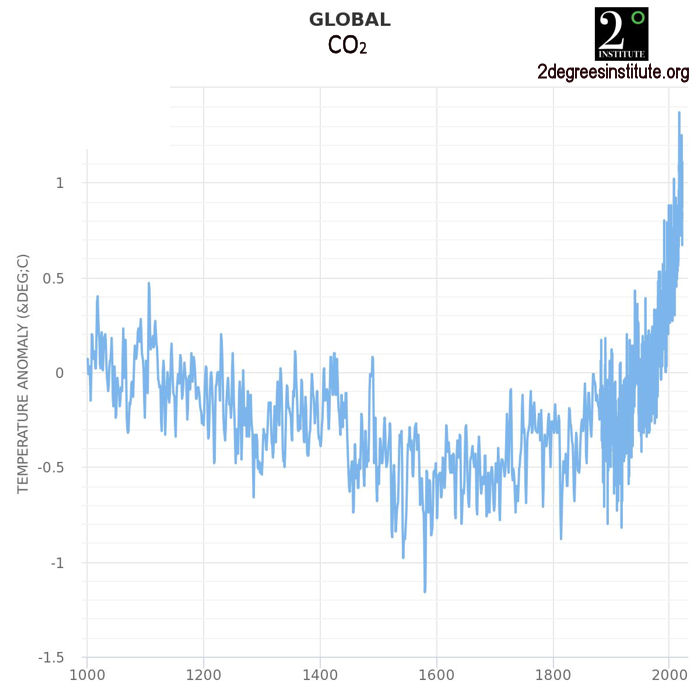
The graphs below show atmospheric CO2 levels over the past 800,000 years and the past 1020 years. The longer term graph illustrates the cyclical nature of atmospheric CO2 concentrations, varying from a low of approximately 173 ppm to a high of approximately 300 ppm until very recently. The shorter term graph shows the more rapid rise, beginning in approximately 1910. The heavier graph line beginning in approximately 1960 shows the instrumented data from the Mauna Loa Observatory in Hawaii. The earlier period concentrations in the graph are based on proxies.
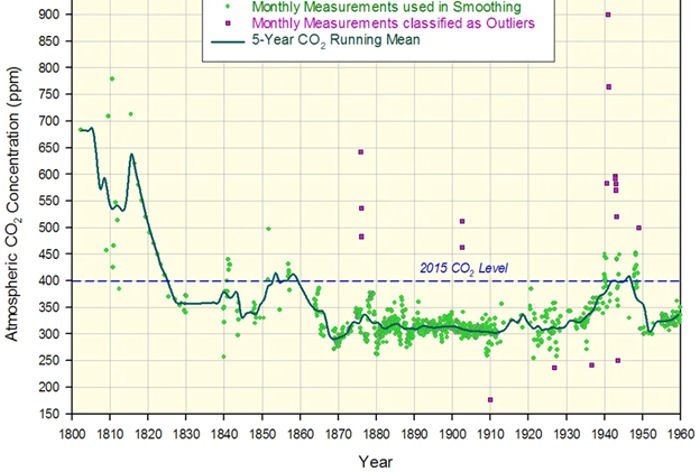
The next graph shows measured data collected in Europe from 1800 until 1960, when the Mauna Loa data became available. This graph clearly shows CO2 concentrations above current levels during the period from approximately 1800 until 1825. These measurements were performed by chemical analysis and their accuracy is disputed, though they should have better resolution than the proxy data shown in the graphs above.
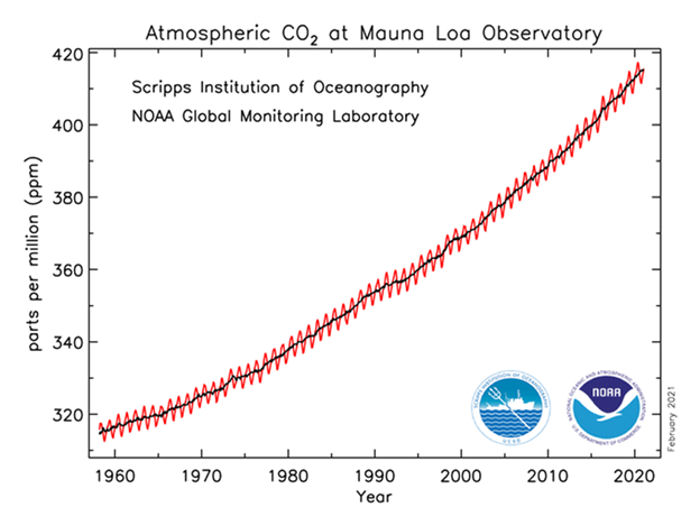
The following graph displays the Mauna Loa data beginning just prior to 1960. This data clearly shows the changes in CO2 concentration on a seasonal basis, as well as the longer-term increase to approximately 415 ppm through 2020.
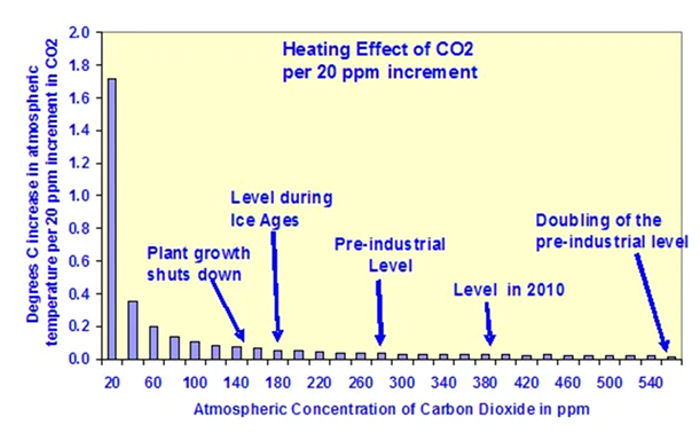
Atmospheric CO2 concentration is considered important by the consensed climate science community, many of whom believe it is the “control knob” for global temperatures. However, as shown in the graph below, the effect of incremental CO2 in the atmosphere decreases logarithmically as the concentration increases.
This result was recently confirmed as the result of research by Happer and Wijngaarden, who studied the infrared absorption spectra for CO2 spectral line by spectral line. They concluded that the absorption potential of CO2 in the atmosphere is virtually ”saturated”, in the sense that additional CO2 would produce virtually no additional warming.
The results of the Happer and Wijngaarden study are consistent with the numerous research results shown in the graph below, which suggest that the sensitivity of the climate to additional CO2 is at or below the low end of the range of sensitivities assumed by the IPCC.
It is clear from the graphs above that atmospheric CO2 concentrations have increased in the period since about 1950. Global annual CO2 emissions continue to increase, driven largely by increasing fossil energy consumption in the developing nations of Asia and Africa. However, the research of Happer and Winjgaarden suggests that this increase should have minimal effect on atmospheric heating and global temperatures.