Anomalous Anomalies - ORIGINAL CONTENT
- By:
- Edward A. Reid Jr.
- Posted On:
- Apr 18, 2023 at 7:00 AM
- Category
- Climate Change
anomalous: inconsistent with or deviating from what is usual, normal, or expected
anomalies: deviations from the common rule
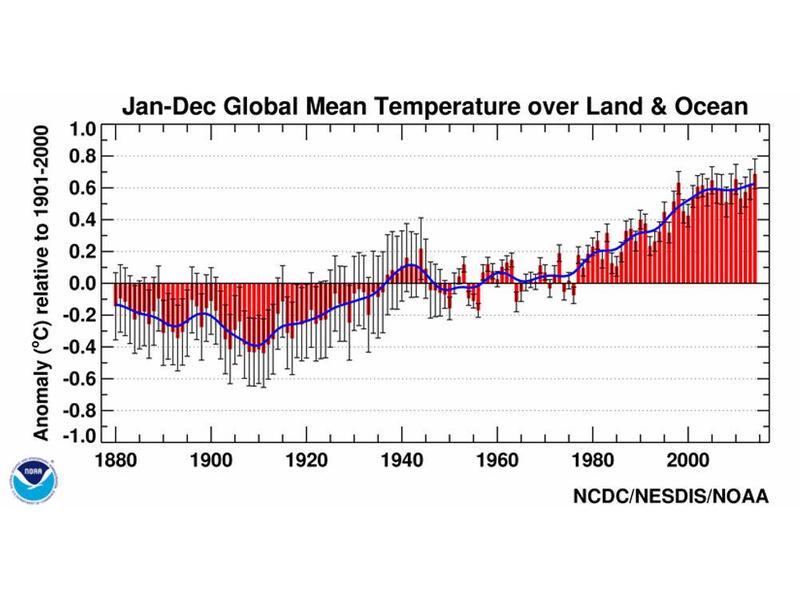
Global warming is monitored by estimating successive global average temperature anomalies (“deviations from the common rule”) from the global average temperature over a historical climatology period. The temperature anomalies calculated by various government and non-government agencies are not directly comparable because the agencies use different climatology reference periods. However, there is general agreement that the global climate has warmed by 1.0+/- 0.2°C over the most recent century. The graph below is a typical presentation of global average temperature increase over time.
Note that the “Y” axis of the graph is truncated to a range of 2°C rather than the full range of temperatures experienced over the earth over the base time period, which range from -89.2°C (-128.6°F) to 56.7°C (134.1°F).
I have previously used Wichita, Kansas to provide an anomalous perspective on global warming (here), (here) and (here). Wichita, Kansas is located very close to the geographic center of the contiguous United States. The annual average temperature in Wichita is approximately 57°F (13.9°C), which is also the current global average near-surface temperature.
The graph below originated on the Powerline blog and has been modified here with the addition of the red and blue bands representing the average diurnal temperature ranges for the peak summer month (July, red) and peak winter month (January, blue) in Wichita. This allows comparison of the global average annual temperature change over the period from 1880 through 2015 (~1.6°F), the orange line on the graph, with the average diurnal and peak seasonal temperature changes in Wichita. (Note that the chart temperature range is from -10°F to +110°F, slightly lower than the -22°F to +114°F record temperature range for Wichita over the same period.)
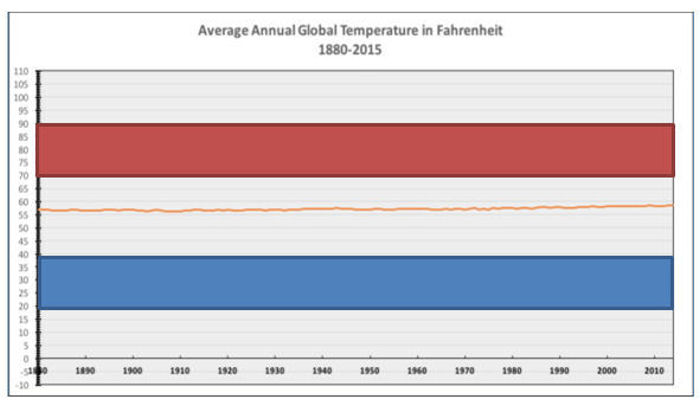
The local temperature anomaly in Wichita has ranged from approximately +57°F (+31.6°C) to approximately -79°F (-43.8°C) over the base period from 1880 to present. The local diurnal temperature anomaly in Wichita is approximately 20°F (11.1°C), as shown above, for both the peak summer month (July) and the peak winter month (January). The local peak seasonal average temperature anomaly is approximately 50°F (27.7°C).
This graph puts the global annual average temperature anomaly in a very different perspective from the NOAA graph which preceded it. The global annual temperature anomaly over the 140+ year base period is slightly more than 1% of the local peak temperature anomaly in Wichita over the period.
The graph below shows the satellite temperature record for the period 1979- January 2023, relative to the 30-year climatology period 1991-2020, reported by Dr. Roy Spencer of the University of Alabama Huntsville. UAH reports warming of +0.13°C per decade, or approximately 0.57°C since 1979. However, the monthly temperature anomalies over the period have ranged from approximately -0.68°C to +0.70°C, or more than twice the average anomaly.
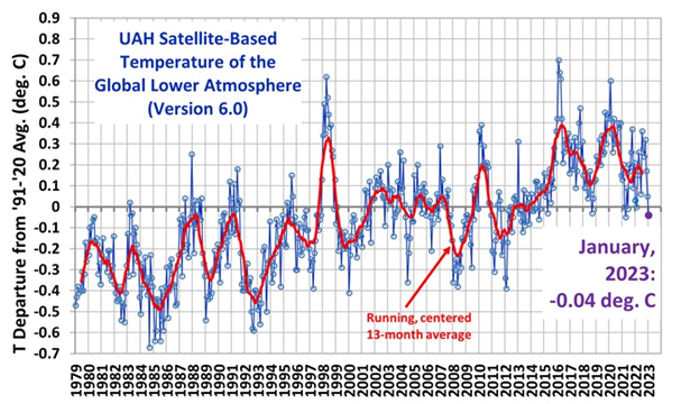
The monthly satellite lower troposphere temperature anomaly for the contiguous United States varied from +0.88°C to – 0.51°C over calendar year 2022, a range of 1.39°C, or approximately 1.7 times the global annual average temperature anomaly over the 140+ year base period shown in the NOAA graph above.
Against this background, a cumulative temperature anomaly of 1.0 +/- 0.2°C over a 140+ year period does not seem particularly significant, nor does a projected future anomaly increase of 0.5°C-1.0°C.