Wind Capacity Factor - ORIGINAL CONTENT
- By:
- Edward A. Reid Jr.
- Posted On:
- Apr 2, 2024 at 6:00 AM
- Category
- Energy Policy, Climate Change
The capacity factor of wind generation systems varies as a function of geography, season of the year and time of day. The capacity of wind generation systems varies as a function of swept area, wind speed and turbine height. The current US wind turbine generation fleet has a capacity factor of approximately 35%. The capacity factor peaks in Spring at more than 40% and reaches a low in the mid-to-upper 20% range in Summer.
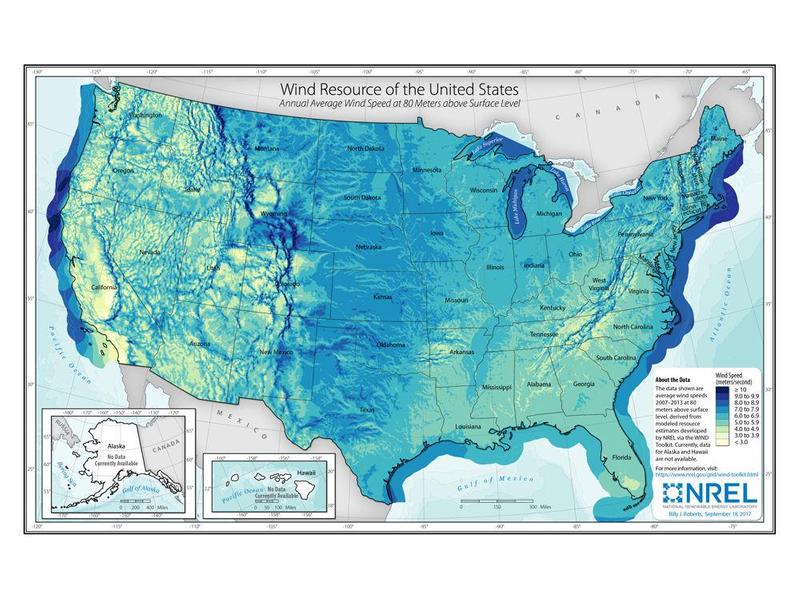
The map below shows the annual average wind speed at an elevation of 80 meters in the United States. Wind power density varies as the cube of wind speed, so wind speed is an extremely important siting factor. For example, an area with an average wind speed of 8 meters per second would offer a wind power density 8 times the wind power density available at an average wind speed of 4 meters per second. The area of the US with the highest annual average wind speeds extends North to South through the center of the contiguous 48 states, as shown below.
The viewer at this link shows the locations of US wind facilities. The viewer can be adjusted to show the heights of the wind turbines and their capacities. The average individual wind turbine capacity at the installations shown in the viewer is 2 MW. Note that the wind turbine elevation at most of these installations exceeds 100 meters and approaches 200 meters.
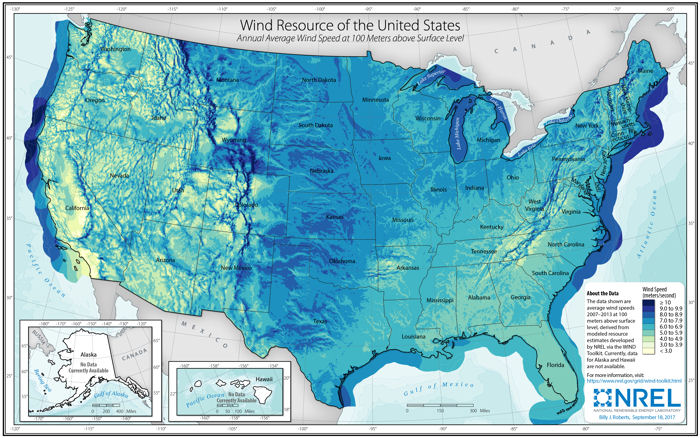
The map below illustrates the US wind resource at an elevation of 100 meters, showing the greatest resource in the mid-continent, around the upper Great Lakes and along the East, West and Gulf coasts.
The map below illustrates the US wind resource at an elevation of 200 meters, showing a similar resource distribution, but a significant increase in the magnitude of the available wind resource. This is clearly the incentive for increasing wind turbine mounting heights.
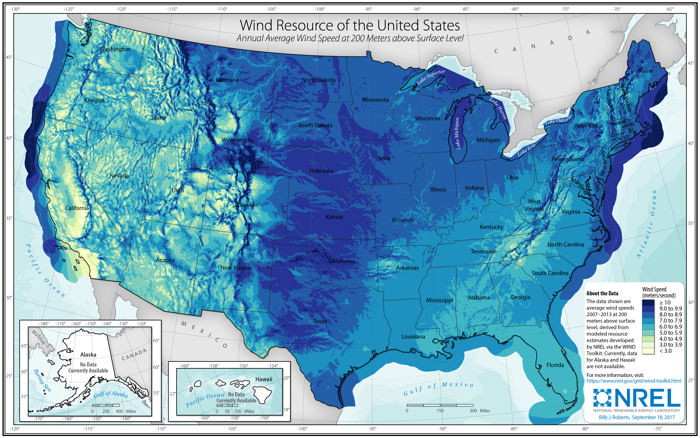
These maps also illustrate the reason for the interest in offshore wind. The offshore wind velocities are significantly higher than onshore wind velocities near the coasts. Offshore location avoids wind installations in the densely populated coastal areas. Also, offshore wind installations would reduce transmission distances from the generator installations to the population centers along the coasts.
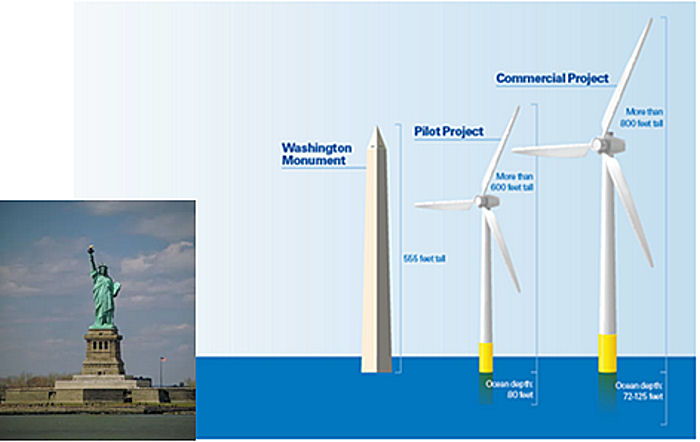
The images below show the relative height of the Statue of Liberty, the Washington Monument and the 15 MW wind turbines planned for the Dominion Energy Coastal Virginia Offshore Wind (CVOW) project. The Statue of Liberty stands 305 feet (93 meters) above sea level. The Washington Monument stands 555 feet (169 meters) above local grade. The turbine towers of CVOW would be approximately the same height as the Washington Monument. The rotor diameter would exceed 450 feet (137 meters), with a peak elevation above sea level of more than 800 feet (244 meters).
The International Energy Agency (IEA) uses a capacity factor of 50% for offshore wind turbines, or approximately 40% higher than for onshore wind turbines. However, the cost per unit capacity for offshore wind turbines is higher than for onshore turbines and the cost of maintenance and repair is significantly higher.