The capacity factor of solar photovoltaic generation systems varies as a function of geography, season, time of day, weather conditions and solar collector type. The most common utility scale solar array consists of numerous parallel rows of flat plate collectors mounted in a fixed orientation and at a fixed mounting angle. In this installation configuration, the incoming solar insolation is perfectly perpendicular to the collector surface twice each year. Throughout the remainder of the year, the insolation strikes the collector surface from a above or below and from further East or West than the perpendicular, which reduces the ability of the solar system to achieve rating plate capacity.
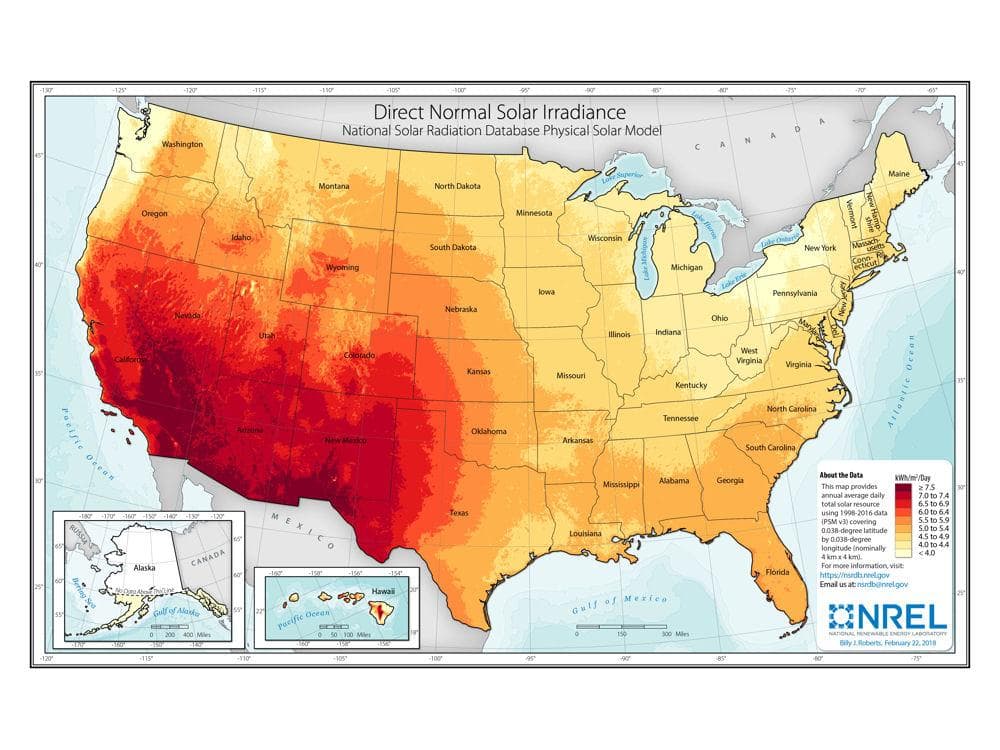
The current fleet of these fixed solar arrays achieve an average annual capacity factor of approximately 25%. However, the monthly average capacity factor of current systems ranges from a high of ~32% in May and June to a low of ~13% in December, as the result of both lower sun elevation and reduced hours of daylight. These capacity factors are primarily for solar installations in the US desert southwest, where the seasonal variation in daily solar insolation varies by a factor of approximately 2.5, as illustrated in the maps shown here.
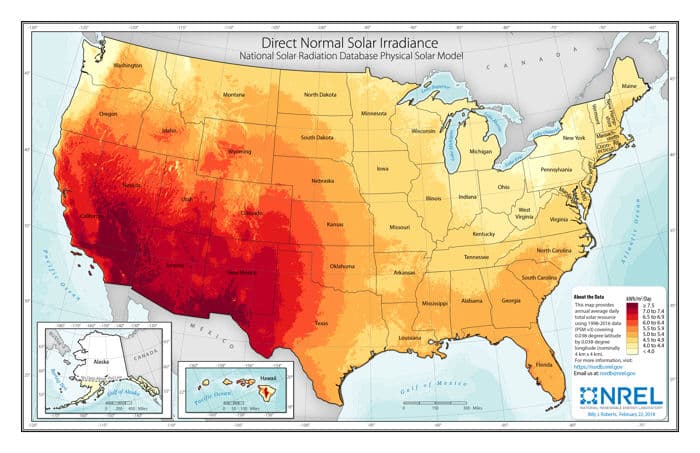
The map below illustrates the variation of annual direct solar insolation across the US.

As utility scale solar installations continue to expand beyond the US southwest, the annual capacity factor of the solar installations will decrease as the result of lower sun angle and shorter hours of daylight, particularly during the winter months. For example, the realistic average daily solar insolation in Phoenix, Arizona reaches a peak of `6.7 kWh/m2/day in June and declines to ~2.5 kWh/m2/day in December, an approximate 63% reduction from peak. However, in Buffalo, New York the realistic average daily solar insolation reaches a peak of ~4.9 kWh/m2/day and declines to ~0.9 kWh/m2/day in December, an approximate 82% reduction from peak. Fairbanks, Alaska experiences a realistic average daily solar insolation peak of ~4.6 kWh/m2/day in June and declines to ~0 kWh/m2/day in December, an approximate 100% reduction.
The lower peak average daily solar insolation in most of the US, relative to the average daily solar insolation in the desert southwest, suggests that solar installations in most of the US would achieve lower capacity factors throughout the year, but especially in the winter, and would therefore have to be significantly larger than southwest installations to achieve the same annual generation output. For example, a solar installation in Buffalo, NY would be expected to have an annual capacity factor of approximately 18%.
The reduced solar capacity factors in the winter months would become an increasing concern as the US energy economy transitioned to “all-electric everything”, as most electric utilities would transition from summer peaking to winter peaking as fossil fueled space and water heating systems are replaced with electric appliances and equipment. Peak electricity demand would coincide with significantly reduced solar electricity generation, magnifying the need for electricity storage to bridge the gap between supply and demand.