Perspective is Important
- By:
- Edward A. Reid Jr.
- Posted On:
- Sep 20, 2016 at 8:02 AM
- Category
- Climate Change
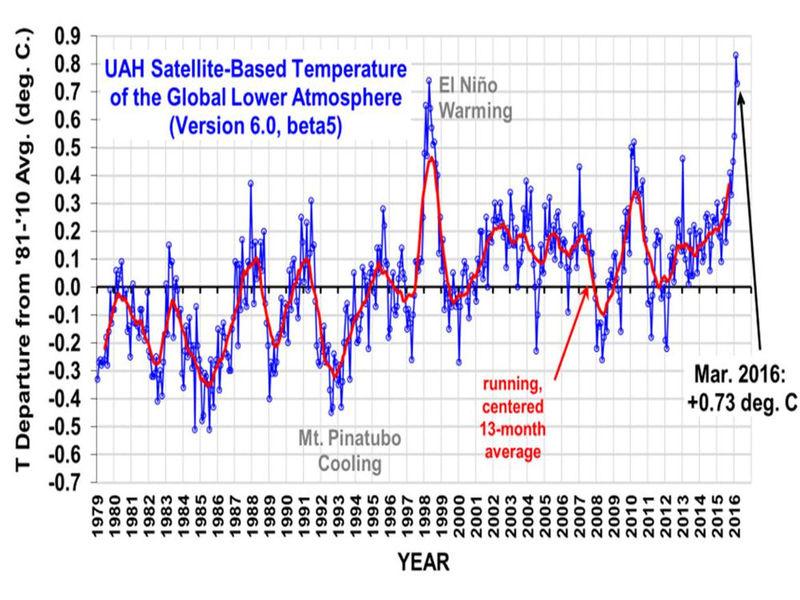
The graph below displays the entire history of the satellite temperature record, as analyzed by Drs. John Christy and Roy Spenser at the University of Alabama-Huntsville on behalf of NASA.

The graph clearly shows the very strong El Nino events in 1997-1998 and 2015-2016, as well as the somewhat weaker El Nino event in 2009-2010. The graph suggests that the current El Nino has peaked; and, that temperatures will likely fall over the next several months. There is no reliable way to predict how far temperatures will fall. However, the transition toward La Nina conditions appears to have begun, with NOAA forecasting a moderate to strong La Nina, beginning in the late Spring to early Summer of 2016.
The current El Nino has, at least temporarily, halted the temperature “hiatus” or “pause” experienced over the past ~18 years. Discussion of the global average near-surface temperature increases provided by NCEI, NASA GISS and The Hadley Center have focused almost exclusively on the “warmest year ever” narrative, largely to the exclusion of discussion of the impact of the major El Nino event on those temperatures. However, as can be seen in the above graph, the temperature increases associated with the 1997-1998 and 2009-2010 El Ninos were essentially sharp spikes of relatively short duration, after which temperatures returned to very nearly the levels reported before the onset of the El Ninos. The anomaly increase in response to the current El Nino has followed the same characteristic sharp spike pattern; and, the fall toward the transition appears to be following the same pattern as well.
The graph below displays the El Nino to La Nina transitions as reflected in sea surface temperature anomalies in the eastern Pacific. Note that SSTs for both the 1997-1998 and the 2015-2016 El Nino events appear to have peaked in November of the year in which they developed. The 1997-1998 El Nino transitioned to La Nina conditions in June; and, the La Nina reached its negative peak in December of 1998. The current El Nino has, so far, followed a very similar pattern. The pace and extent of the decline in the SST anomaly will determine whether 2016 will replace 2015 as “the warmest year ever”.
.jpg)